
Table of Contents
A critical aspect of GxP compliance is temperature mapping—a validation process that ensures controlled environments, such as warehouses, cold rooms, and storage units, consistently maintain appropriate temperature and humidity levels (and other environmental parameters like pressure, particulate, etc.. as applicable).
However, traditional temperature mapping methods are often slow, labor-intensive, and reactive. As the pharmaceutical industry embraces digital transformation, these outdated approaches are becoming increasingly inadequate. In response, xLM , has introduced Continuous Temperature Mapping (cTM)—an innovative, AI-powered solution designed to provide real-time visibility, efficiency, and compliance in temperature monitoring.
1. Status Quo: The Challenges of Traditional Temperature Mapping
For decades, organizations have followed a conventional approach to conducting temperature mapping studies. While effective, this method is manual, time-consuming, and data-fragmented:
Sensor Setup
Technicians install data loggers across designated mapping zones. This process can take several days and requires strict adherence to validation protocols.Passive Data Collection
Once the mapping begins, sensors collect data over a defined study duration (typically 7–15 days). However, there is no visibility into anomalies until the study concludes.Data Extraction & Consolidation
After the study, data is manually extracted from individual sensors and combined into a master Excel file. This introduces opportunities for human error, formatting issues, and inconsistencies.Manual Analysis
Analysts sift through the data, performing variance checks, calculating statistical parameters, and preparing summary reports. Such tasks are error-prone and labor intensive. And, most insights are reactive.Report Generation & Review
Findings are formatted into a formal report, reviewed by QA, and submitted for signoff. This process can take several days or weeks, especially across multiple sites.Audit Challenges
Due to the manual nature of data review and analysis, creating a defensible audit trail is challenging without additional controls.
This approach is simply not scalable for modern pharmaceutical companies, particularly those with multiple storage locations, products in cold chains, or global regulatory exposure.
2. Enter cTM: Continuous Temperature Mapping
Continuous Temperature Mapping (cTM) represents a significant advancement aimed at eliminating these legacy inefficiencies. It integrates Industrial IoT (IIoT) sensors, cloud infrastructure, and AI-powered analytics to facilitate real-time environmental monitoring, automated compliance, and decision intelligence across facilities.
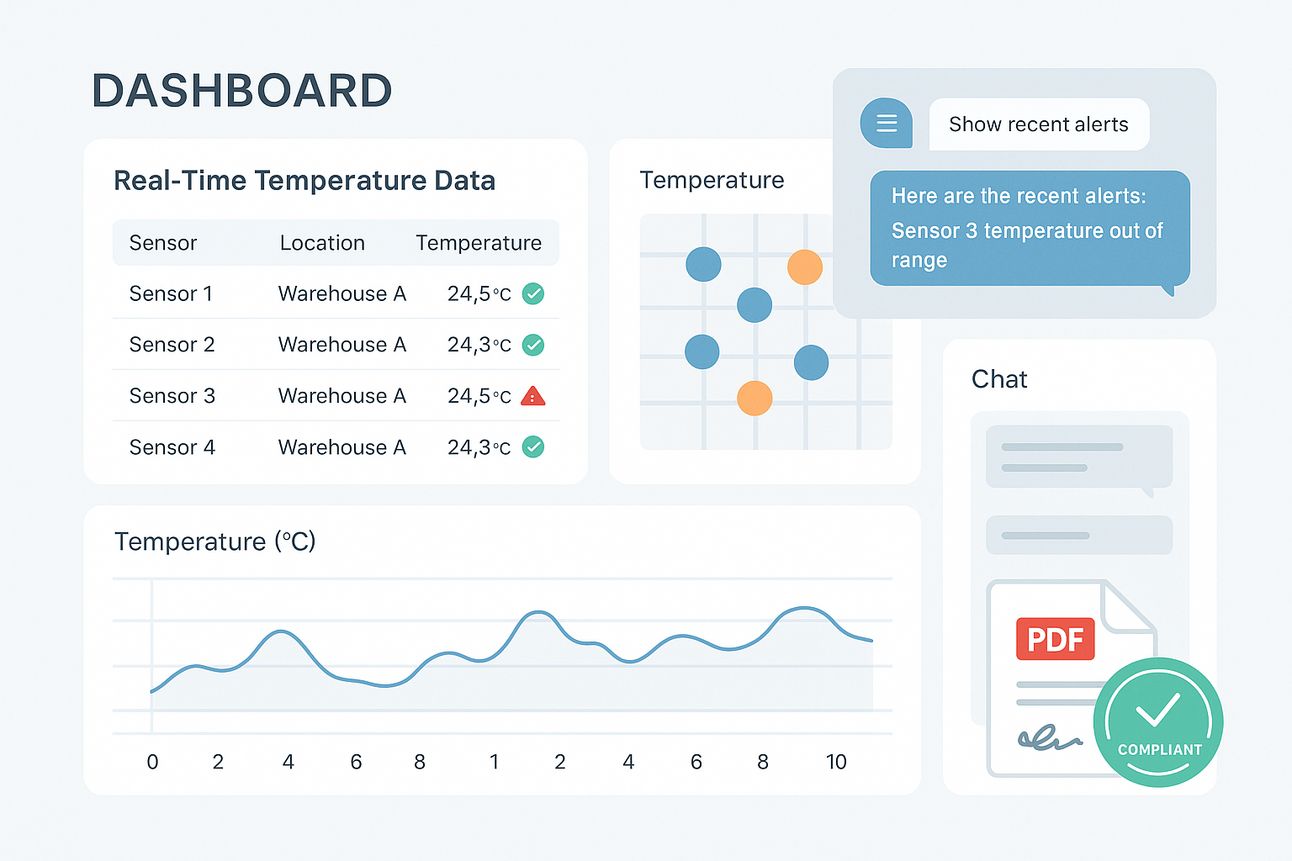
At the core of cTM is an intelligent orchestration of:
Wireless IoT-enabled RF sensors for temperature, humidity, pressure, particulate, etc..
AI/ML agents for data validation, anomaly detection, and forecasting
GxP-compliant dashboards with built-in audit trails
Natural language data exploration via “Zippy - Data Chatbot”
Automated report generation, meets predicate as well as 21 CFR Part 11 and EU Annex 11
The outcome? A system that is not only compliant by design but also agile, intelligent, and proactive.
3. Key Features: What Makes cTM Revolutionary?
3.1. Interactive Dashboards

Temporary Sensor Networks used during validation
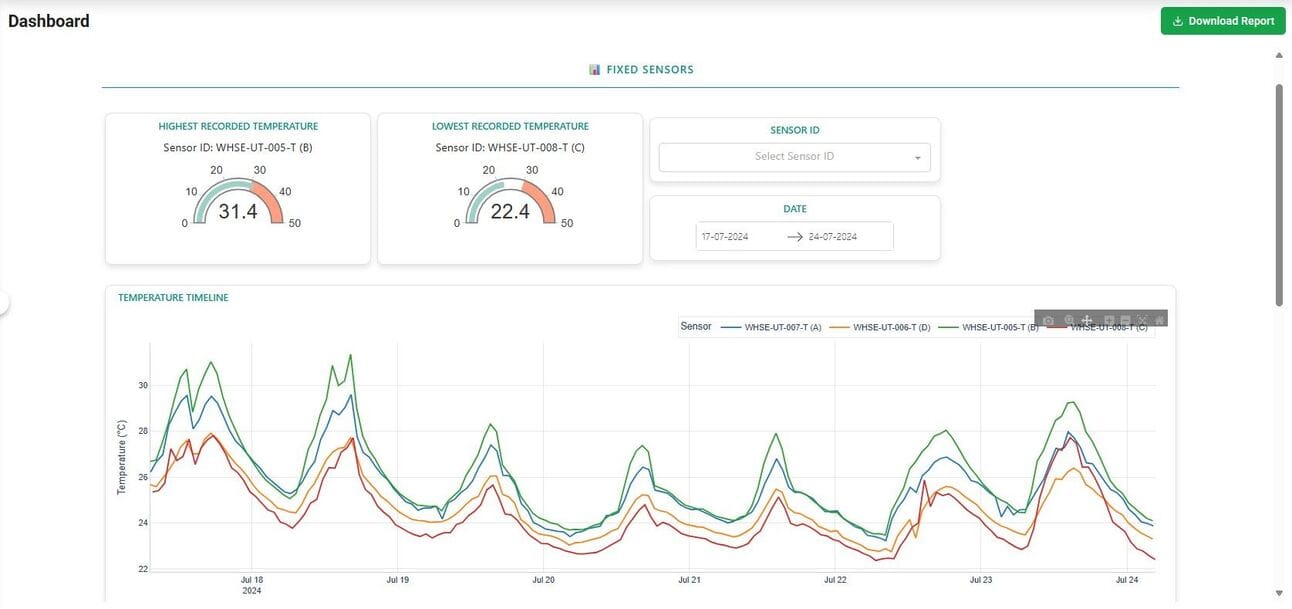
Temporary Sensors installed for continuous monitoring
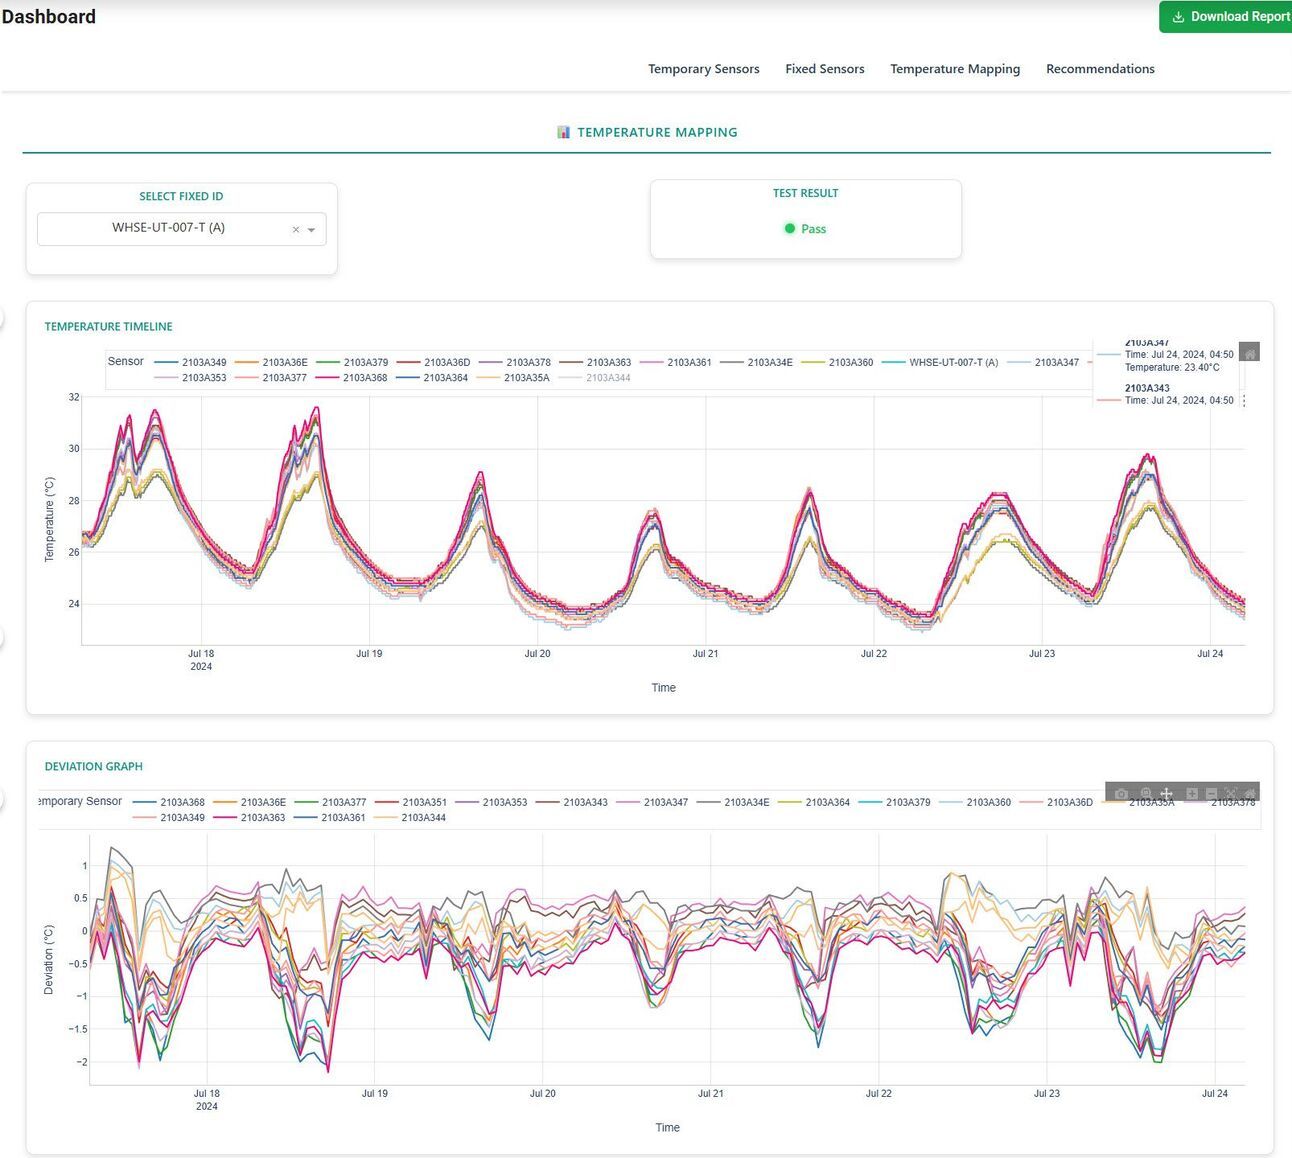
Temperature and Deviation Timelines
Dashboards are updated in real time and allow for role-specific drilldowns; for example, QA teams can monitor excursions while engineering focuses on performance, control, uniformity, hot/cold spots, etc..
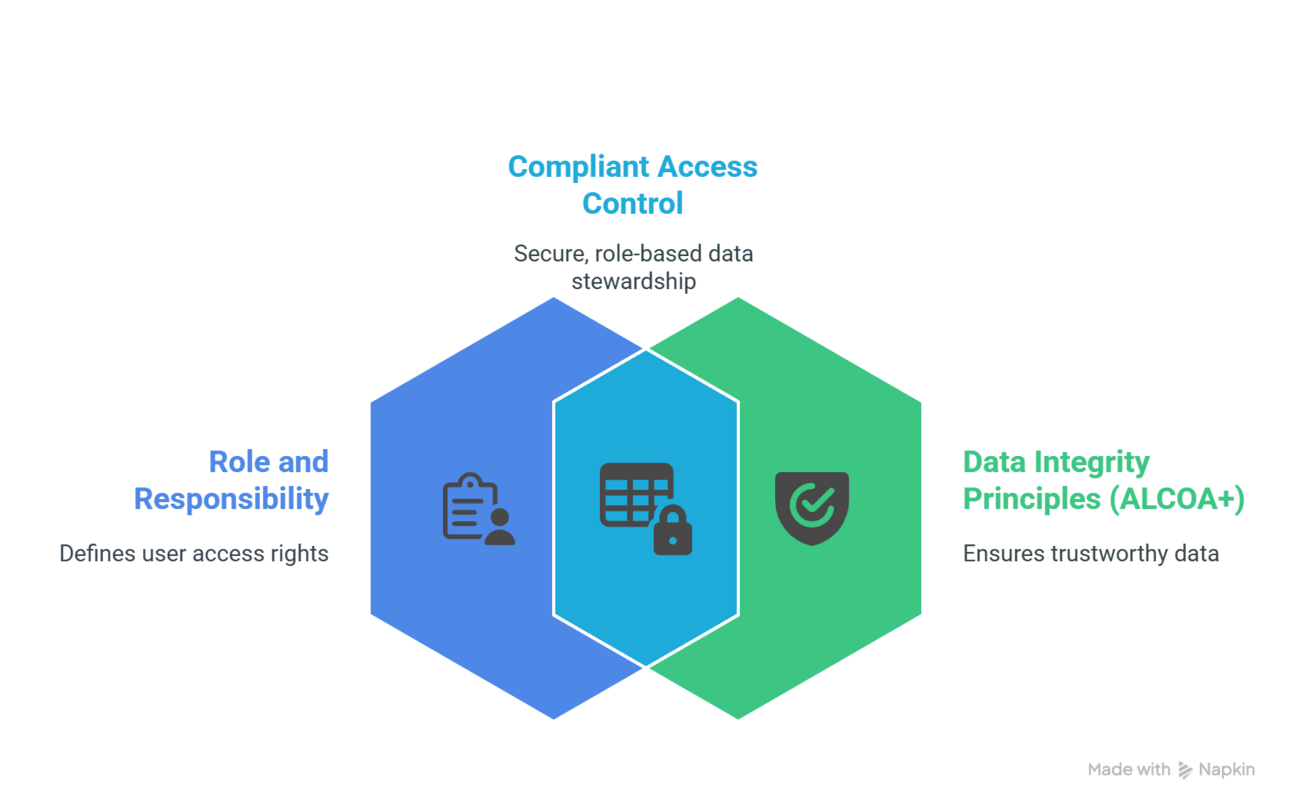
3.2. Role-Based User Access
Each user accesses only the information relevant to their role. Access is governed by role and responsibility, supporting data integrity principles (ALCOA+) and ensuring compliance with GxP policies.
3.3. AI-Driven Recommendations
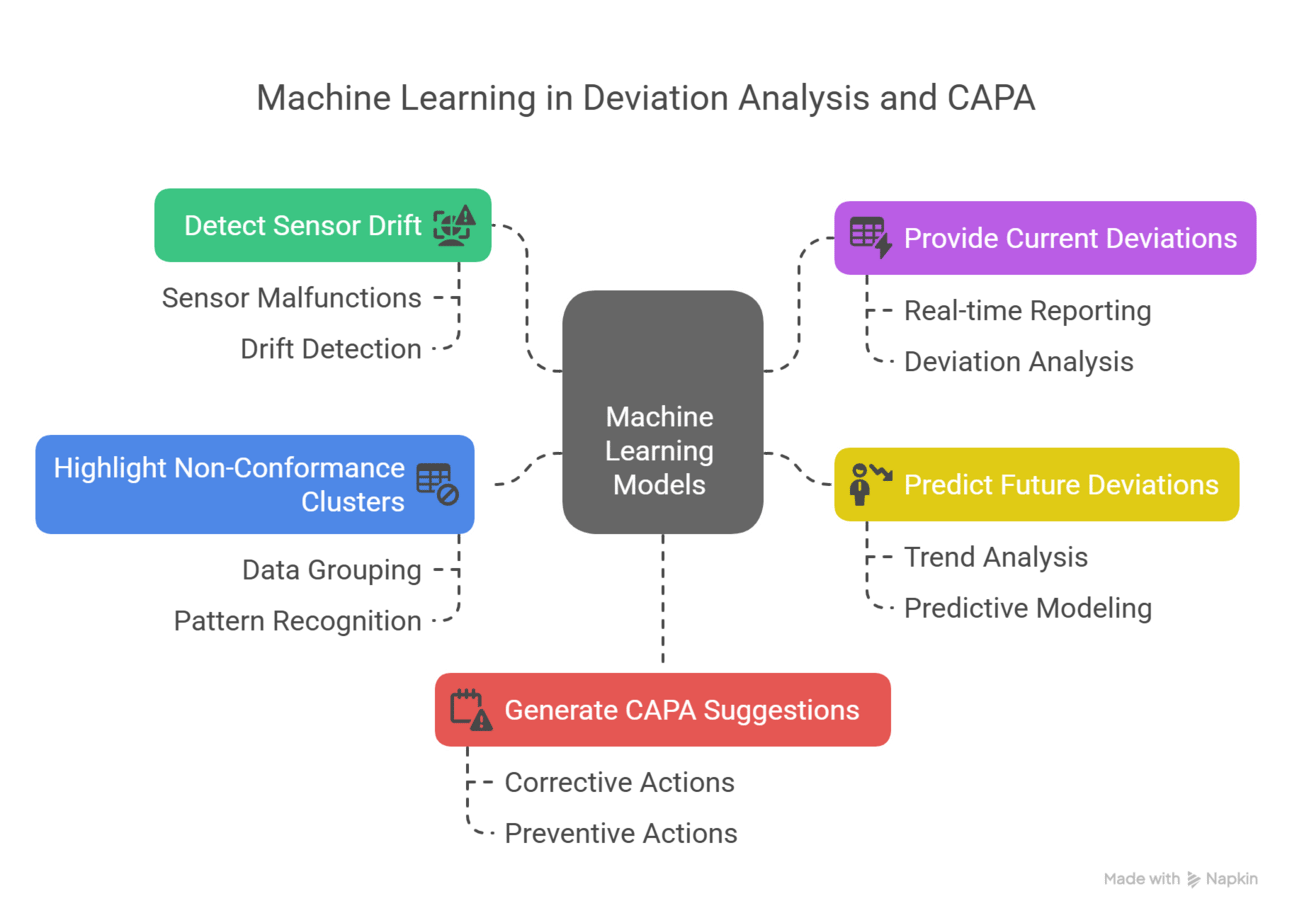
Machine learning models analyze patterns and automatically:
Detect sensor drift or malfunctions
Provide current deviations
Predict future deviations
Highlight non-conformance clusters
Generate corrective and preventive action (CAPA) suggestions
3.4. Zippy - Chat with your Data
Users can query the dataset using natural language, such as:
“Show all sensors that exceeded 25°C last week.”
“Graph the average humidity across Zone 2 for the last 90 days.”
This feature democratizes data access, enabling even non-technical users to extract insights.

3.5. Encrypted, Auto-Generated GxP Reports
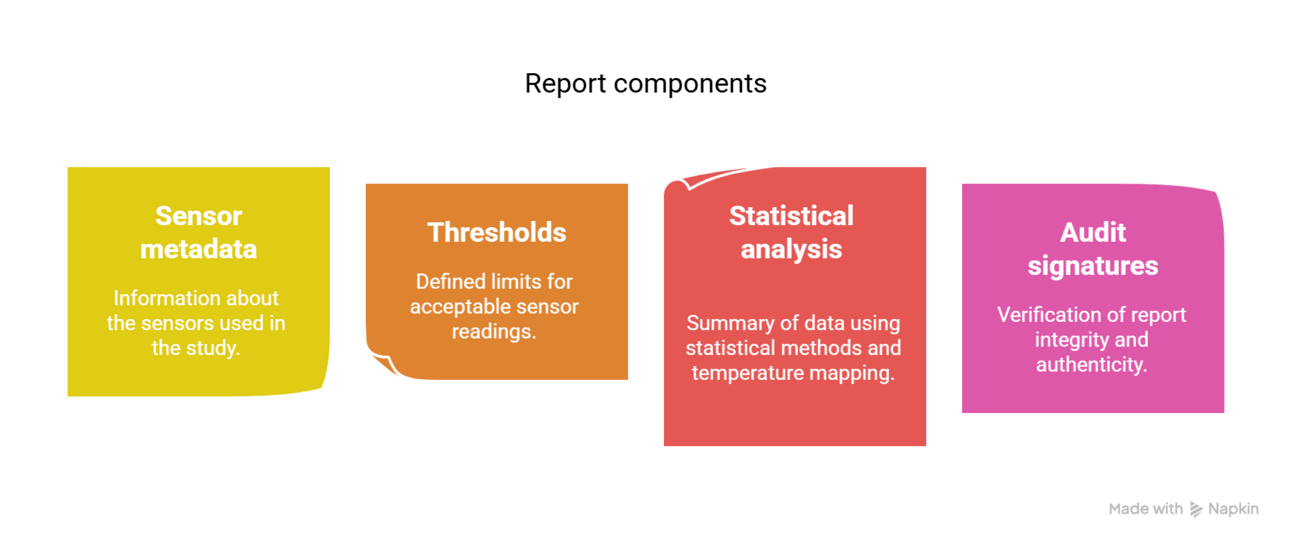
Reports are automatically compiled, encrypted, and stored in a version-controlled, compliant format. Each report includes:
Sensor metadata
Thresholds
Statistical analysis
Audit signatures
3.6. Complete Audit Trails
Every action—ranging from user logins to data queries and report downloads—is recorded in a tamper-proof audit trail, ensuring traceability and accountability.
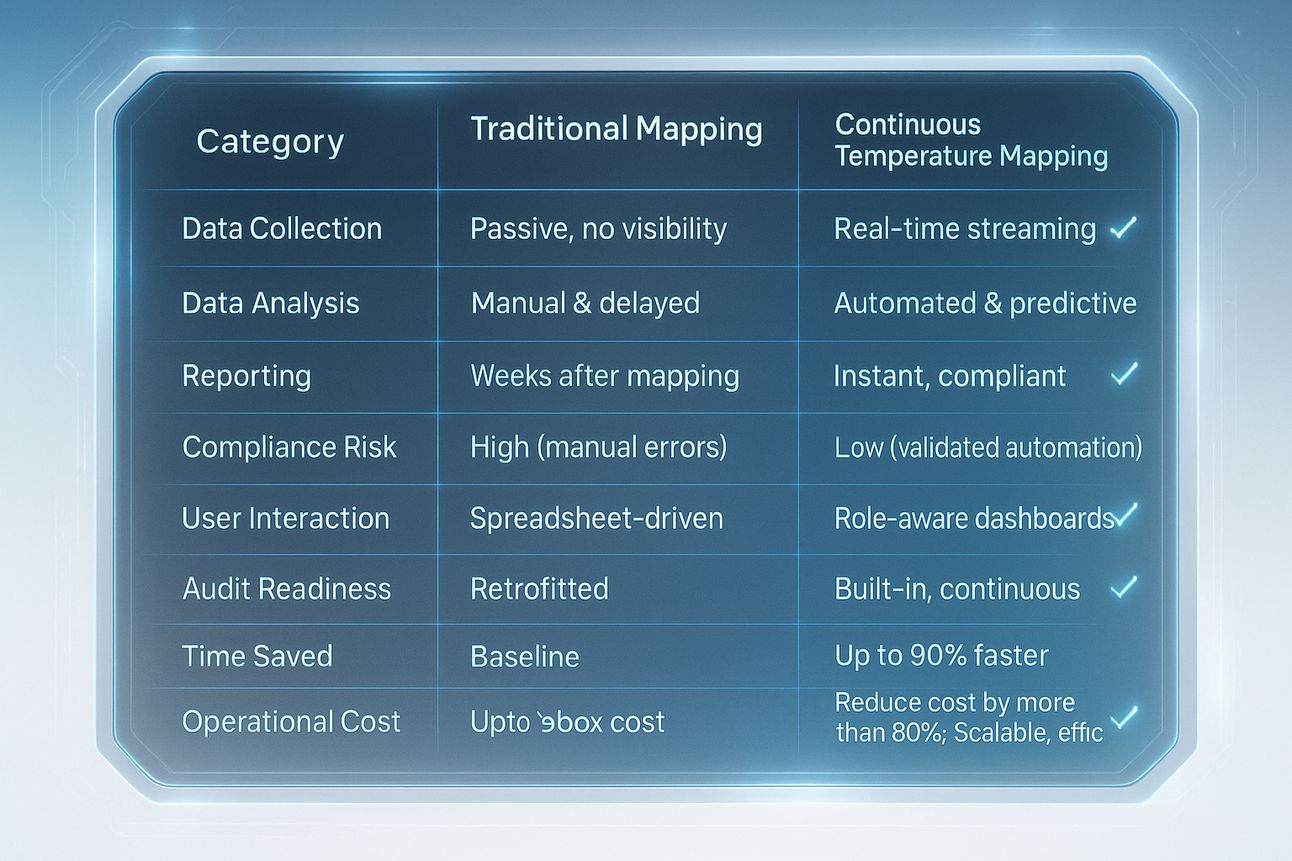
4. Traditional vs. cTM: Measurable Impact
5. Conclusion: cTM — The Future of GxP Temperature Compliance
The pharmaceutical industry continuously faces pressure to maintain product quality, ensure patient safety, and comply with stringent regulatory standards. In this dynamic landscape, Continuous Temperature Mapping is not merely a technological upgrade; it is a strategic enabler.
With real-time insights, automated analytics, and robust compliance, cTM platform empowers pharmaceutical manufacturers and logistics providers to reclaim control, reduce risk, and enhance productivity.
If your organization is still relying on outdated temperature mapping workflows, now is the time to explore how cTM can transform your compliance operations and future-proof your environmental monitoring strategy.


